
Report Interpretation Guide
Interpreting your report
Your report consists of insights via the NatureMetrics Intelligence Platform and an Excel data tables file.
Guidance for our previously issued PDF reports are also included here.
Excel data tables - results at the individual sample level:
- Data Description
- Species Data Table Percentages
- Species Data Table Read Counts
- Metrics by Sample Table
- Quality Control Table
PDF report:
- Executive Summary
- Overview of Species Detected
- Highlighted Species of Interest
- Community Composition
- Metric Charts
Throughout this guide, words highlighted in bold are defined in the glossary (bottom section).
Your PDF Report
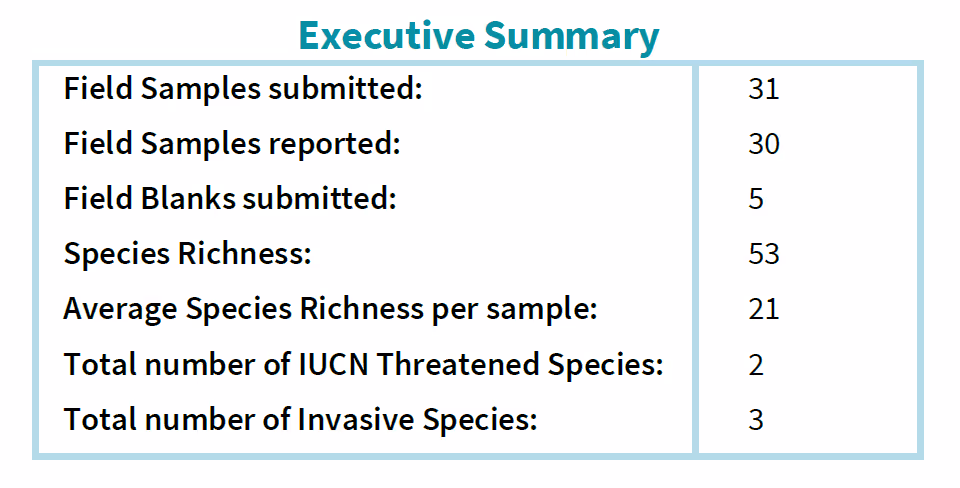
Executive Summary
This includes information on the number of samples submitted, how many of these samples were reported (i.e. passed all quality controls), the total number of OTUs (Operational Taxonomic Unit) detected across all samples, the average number of OTUs per sample, and the number of species detected that have conservation designations such as IUCN Threatened Species or Invasive Species.
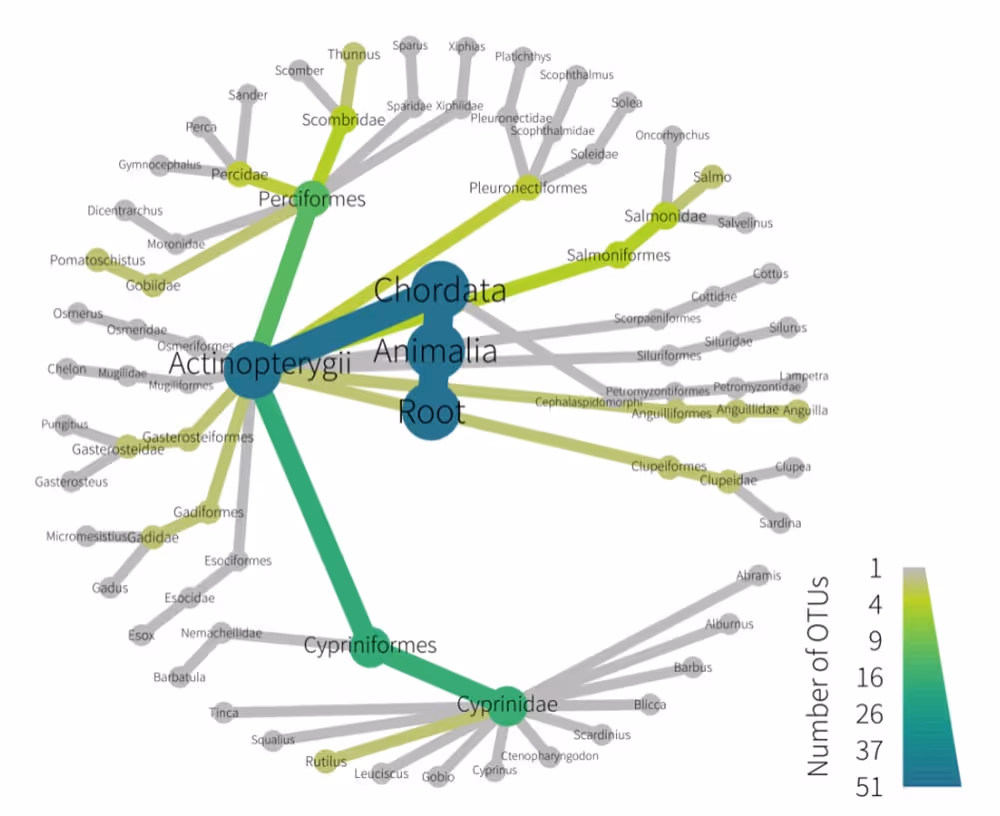
Overview of Species Detected
This chart provides a tree-of-life view of the species detected in your samples and their taxonomic relationship, (names on the same branch are more similar than those on different branches). The chart is structured with the highest taxonomic rank at the centre (e.g. kingdom, phylum, class), moving through the ranks of order, family, genus, species as you move to the outer edge. Note that the centre and outer ranks will change depending on the test applied and the number of species detected. The legend in the bottom right of the chart indicates how to relate the color in the branches to the number of species. The color scale goes from grey indicating very few species to blue indicating a lot of species.
Taxonomic Resolution
This table provides the number of OTUs detected and the percentage of OTUs identified to each taxonomic level.
Depending on completeness of reference databases for the region where you sampled, some OTUs may not match to a reference at species level. Global DNA reference databases contain millions of barcodes, but gaps remain, particularly in regions and taxonomic groups that are more diverse and less studied. Coverage is expected to improve over time and data tables can be updated to include new information at a future date.
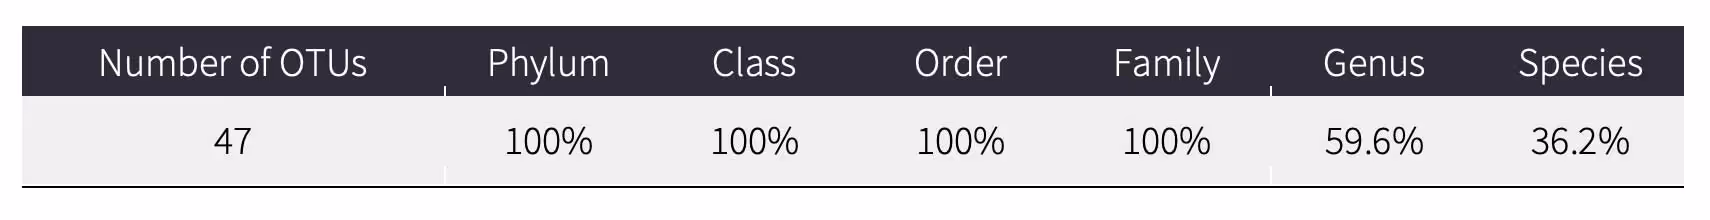
In this example, 47 OTUs were detected: 100% (47) were identified to family-level, 59.6% (28) were identified to genus-level, and 36.2% (17) were identified to species-level. A species-level match could not be made for some OTUs using the reference databases, so they are assigned to a higher taxonomic rank (genus or family). There are multiple reasons that an OTU is not assigned to a species, including that the species is not in the reference databases or there could be multiple species in the databases with very similar DNA barcode. In these instances, the OTU is assigned to a higher taxonomy (e.g., genus or family).
Highlighted Species of Interest
We currently have two methods for highlighting species of interest:
IUCN Threatened Species
These are the IUCN (International Union for Conservation of Nature) Red List species detected in your samples. These are detected species that are designated as one of the IUCN Red List Threatened Categories (Vulnerable, Endangered and Critically Endangered). An increase in the number of threatened species is generally associated with a positive trend in biodiversity or habitat condition.
Please note: IUCN Threatened Species is not included for Bacteria.
You might see the following in your Species Data Tables:
- Lower Risk/Conservation Dependent’: Using the 2001 (v3.1) system these taxa are classed as Near Threatened, but those that have not been re-evaluated remain with the Lower Risk/Conservation Dependent category.
- Lower Risk/Near Threatened’: Using the 2001 (v3.1) system these taxa are classed as Near Threatened, but those that have not been re-evaluated remain with the Lower Risk/Near Threatened category.
- Lower Risk/Least Concern’: Using the 2001 (v3.1) system these taxa are classed as Least Concern, but those that have not been re-evaluated remain with the Lower Risk/Least Concern category.
Some taxa included in the current IUCN Red List have not been reassessed since before 2000 and therefore still use the 1994 IUCN Red List Categories and Criteria (Version 2.3). We report these threat statuses in the Species Data Tables as they are currently defined by the IUCN Red List.
None of these differences affect the number of IUCN Threatened Species.
Invasive Species
These are Invasive species detected in your samples. Species are considered invasive in the sampling country if they have been introduced to an area outside their native range and there is evidence they are having a negative impact on native species, ecosystems, or services. This evidence is compiled in the Global Register of Introduced and Invasive Species (GRIIS), which is an IUCN Invasive Species Specialist Group initiative. An increase in the number of invasive species is generally associated with enhanced pressures at your site and reduced resilience of the native community.
Please note: this label is only available for animals; GRIIS lists marine species as invasive for a country, even if the species is known to be invasive in only one marine area bordering the country; GRIIS statuses are sourced from the country checklists available on griis.org, invasive species will not be flagged for countries missing from this page, or for territories and island groups.
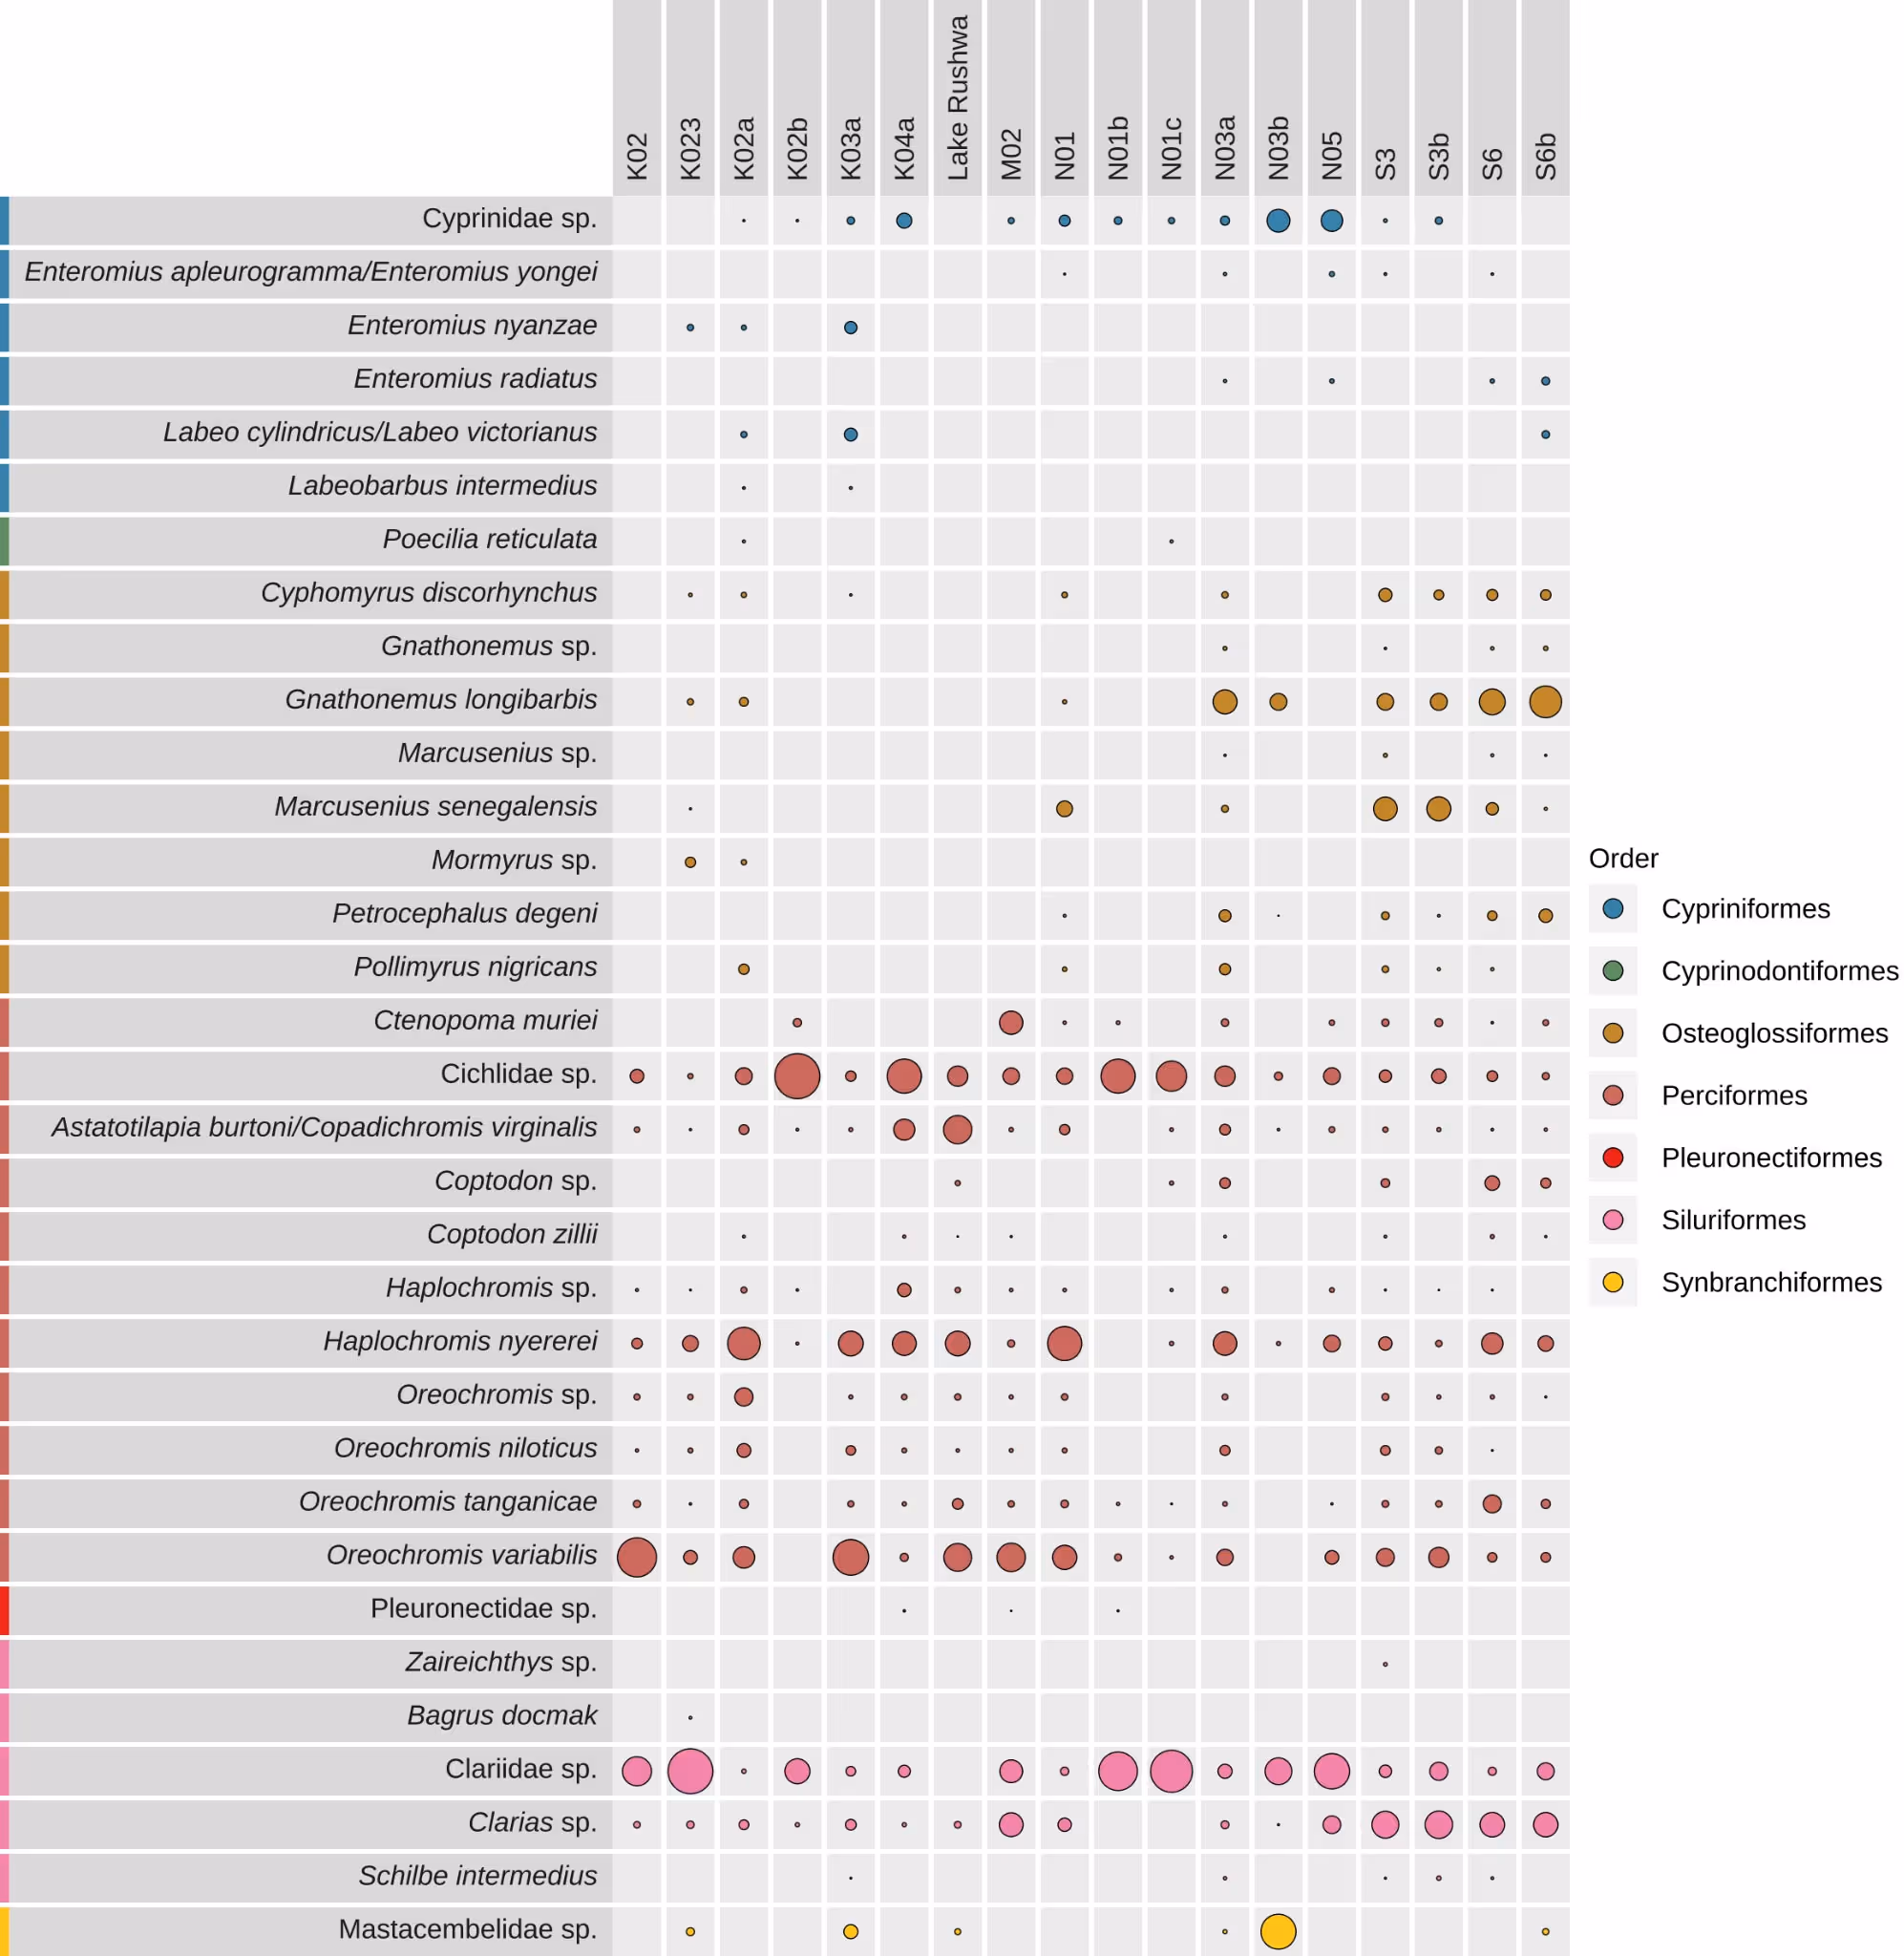
Community Composition
This chart lists the species found in each sample. A bubble means a species was detected in that sample. The chart displays at species level, unless the number of species is too great to display clearly in the document. In this case, the chart displays at a higher taxonomic level. The full species level chart is provided as an appendix.
The size of the bubbles represents the proportion of DNA sequences within a sample. A larger bubble size can indicate a stronger eDNA signal. This signal may be linked to abundance of species in the environment but should be interpreted only as a coarse measure because the signal is also impacted by biological (e.g., biomass, life stage, activity, body condition), environmental (e.g. temperature, pH, salinity, conductivity), and technical factors (e.g. primer bias, PCR stochasticity).
Metrics Charts
Included in your report you will receive the following metrics:
- Species Richness
- Evolutionary Diversity
- Fungal Functional Diversity (where tests for fungi have been purchased)
- Bacterial Functional Diversity (where tests for bacteria have been purchased)
We also provide a suite of additional metrics that deliver added insight to your project. If these have been purchased, they will also appear in your report:
- Marine Fish Community Metrics
- Soil Fungal : Bacterial Ratio
- Marine Sediment Pollution Index
For each metric you will see a plot showing the values for each sample. See below for further information on each metric.
Species Richness
This is the total count of OTUs detected in each sample. We report this both for each sample (i.e., alpha diversity) and for the total number of OTUs from all samples taken (i.e., gamma diversity). It is called ‘Species Richness’ because an OTU is a hypothesised species based upon clusters of similar DNA sequences. This metric is not the sum of OTUs identified to species-level. Although some OTUs cannot be assigned to a species, these are approximately equivalent to species. Higher Species Richness generally indicates a functioning ecosystem in a better condition and is a biodiversity metric that is consistently reported for biodiversity monitoring.
Evolutionary Diversity
Evolutionary Diversity is calculated for each sample. This is a measure of the variety of the diversity of species detected, based on how distantly-related those species are. Evolutionary Diversity is a strong complementary indicator of biodiversity status alongside Species Richness. An increase in Evolutionary Diversity indicates a more varied species assemblage, which is generally associated with a better functioning ecosystem and more ecological niches available. We calculate the Evolutionary Diversity of samples by arranging all OTUs in a family tree based on the similarity of the DNA sequences. The overall size of the family tree (including lengths of all family tree branches) gives the value for Evolutionary Diversity. The metric used is ‘Faith’s Phylogenetic Diversity’ which is commonly used in ecological science and biodiversity monitoring.
Fungal Functional Diversity (applicable for Soil Fungi)
Fungal functional diversity is an overall measure of the different functions provided by all the species detected in a sample. We calculate Fungal Functional Diversity by arranging all samples in a family tree based on the similarity of the functions present in each sample. The length of the branches in the family tree gives the value for Fungal Functional Diversity. This metric is calculated for a sample if 3 or more species have this value, if not this metric will be blank for that sample. An increase in Fungal Functional Diversity implies more pathways of nutrient cycling which can increase soil fertility.
Bacteria Functional Diversity (applicable for Bacteria tests)
Bacterial functional diversity is an overall measure of the different functions provided by all the species detected in a sample. We calculate Bacterial Functional Diversity by arranging all samples in a family tree based on the similarity of the functions present in each sample. The length of the branches in the family tree gives the value for Bacterial Functional Diversity. This metric is calculated for a sample if 3 or more species have this value, if not this metric will be blank for that sample. Increasing Bacterial Functional Diversity implies the bacteria community can perform more ecological functions and be more resilient to environmental changes.
Fish: Food Chain Integrity (available only for the marine water fish test)
The intactness of the food chain based on the trophic level of fish species detected in each sample or site. It is calculated by taking the mean of the trophic level value of each fish species in the sample that contain this value in Fishbase. This metric is calculated for a sample if 5 or more species have this value, if not this metric will be blank for that sample. A greater number can indicate more predators and an improving ecosystem.
Fish: Prevalence of Sensitive Species (available only for the marine water fish test)
The proportion of fish species detected in each sample or site that are vulnerable to human disturbance. It is calculated by taking the mean of the vulnerability score of fish species in the sample that contain this value in Fishbase. This metric is calculated for a sample if 5 or more species have this value, if not this metric will be blank for that sample. An increase implies that a fish community has more vulnerable species and suggests fewer human pressures.
Fish: Commercial Value (available only for the marine water fish test)
The prevalence of economically valuable fishes detected within a sample or site. It is calculated by counting the number of fish species in the sample that have a high or very high price category in Fishbase. This metric is calculated for a sample if 5 or more species have this value, if not this metric will be blank for that sample.. A greater commercial value indicates your fish community consists of more economically important species.
Soil Fungal: Bacterial Ratio (applicable for soil samples)
The ratio of fungal to bacterial DNA in soil from a sample or site, providing an indication of soil health. An increase (i.e., more fungi and less bacteria) indicates progress towards healthier soils and good quality stored carbon.
Marine Sediment Pollution Index (applicable for Invertebrate test from marine sediment samples)
Indicates the pollution level of a sample or site using invertebrate species as indicators. This metric is based on the AMBI marine biotic index (https://ambi.azti.es/). It is calculated by matching species detected in a sample with the sensitivity score of over 11,000 species. This metric is calculated for a sample if 3 or more species have this value, if not this metric will be blank for that sample. A decrease suggests there is less pollution as pollution-sensitive species are more prevalent. The AMBI index has been used to assess the effects of many different human impacts including salmon farms, oil platforms and sand extraction.
Excel Data Tables
The excel file contains five separate sheets.
Read Me
Brief description of the information within the Excel file.
Inconclusive results are reported in the Data Tables as:
- No amplifiable DNA – DNA sequence amplification was not successful. This is due to a low concentration of DNA, or PCR inhibition. Low concentration of DNA usually occurs because there are no target species in the area. For example, marine mammal eDNA concentration is often too low to detect mammals in the sample. However, no amplifiable DNA can also result from a small volume of water filtered, small amount of soil/sediment sampled, or DNA degradation within the sample. PCR inhibition occurs because substances were present that limit PCR. Target groups that are rare, or at very low abundance, will often not be detected. This is a limitation common to all biodiversity surveying methods, not just eDNA-based approaches.
- Data QC step not passed – DNA sequence amplification was successful, but the number of DNA sequences for target DNA was below our minimum reporting thresholds. Samples with low numbers of DNA sequences are removed as they are not considered representative of the sampling location. The metabarcoding technology does not guarantee that data is generated from 100% of samples, and a low percentage of samples do not generate data. We have numerous rigorous troubleshooting steps as part of our pipelines to counter this as much as possible. In cases where a sample does not yield robust data, it is not always possible to pinpoint exact causes. For this reason, we recommend collecting multiple samples per site.
Get the best results from your samples and avoid inconclusive results by following our guidance here.
Species Tables (Percent and Read Counts)
Each row is a separate OTU and information for that OTU is provided, followed by the number of DNA sequences for the OTU in each sample (in columns beginning in column H in the spreadsheet). The numbers in each cell are the percentage of sequences per sample based on all DNA sequences within an individual sample (i.e., the sum of a column is 100%) in the Percentage Species Data Table. The Read Counts Species Data Table displays the actual number of DNA sequences per sample. It should be noted that the abundance of species cannot be directly inferred from the number of sequences.
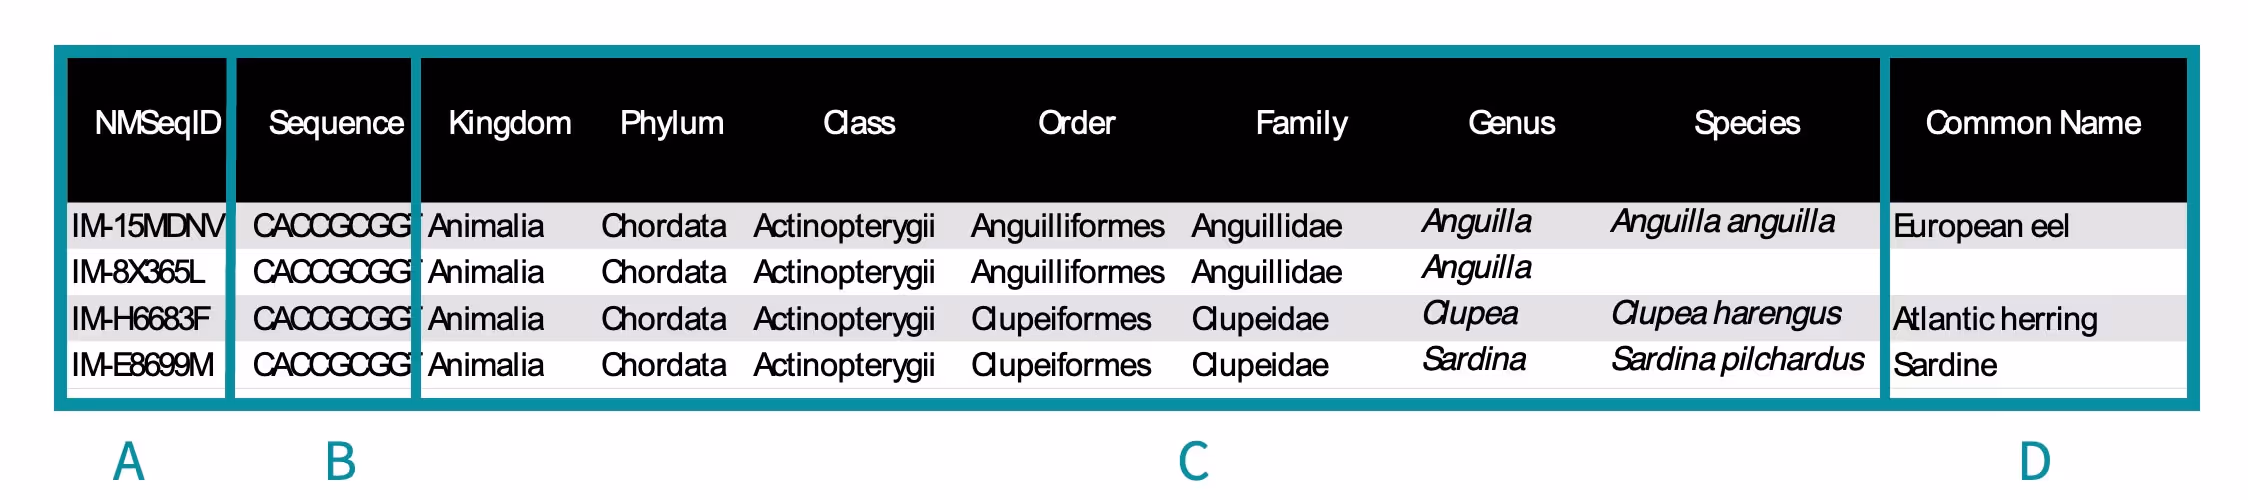
- A. NMSeqID – A unique identification code given to each unique DNA sequences, to allow it to be easily traceable, searched and referenced by NatureMetrics.
- B. Sequence – A DNA sequence found in a sample. It can be assigned to a species when matched to a reference DNA sequence within reference databases. This sequence allows for further analyses by the client.
- C. Taxonomy – The taxonomic assignments given to each DNA sequence. A species-level assignment will be given if reference databases contain an exact DNA match. A higher taxonomic level such as genus or family will be assigned if an exact match is not found. This means that the DNA sequence detected belongs to a species within that assignment, but the exact species could not be assigned. Species-level identification may not be given if the species is not in reference databases. Note: If you are sampling in a remote location and wish to check the quality of reference data for that area, speak to our team before sampling. Reference databases can be supplemented with DNA sequences of local species using our Barcoding Service (only available for fish and amphibians).
- D. Common name – The common name is provided by matching it with the scientific name. The common name is given only if it is available in public databases.
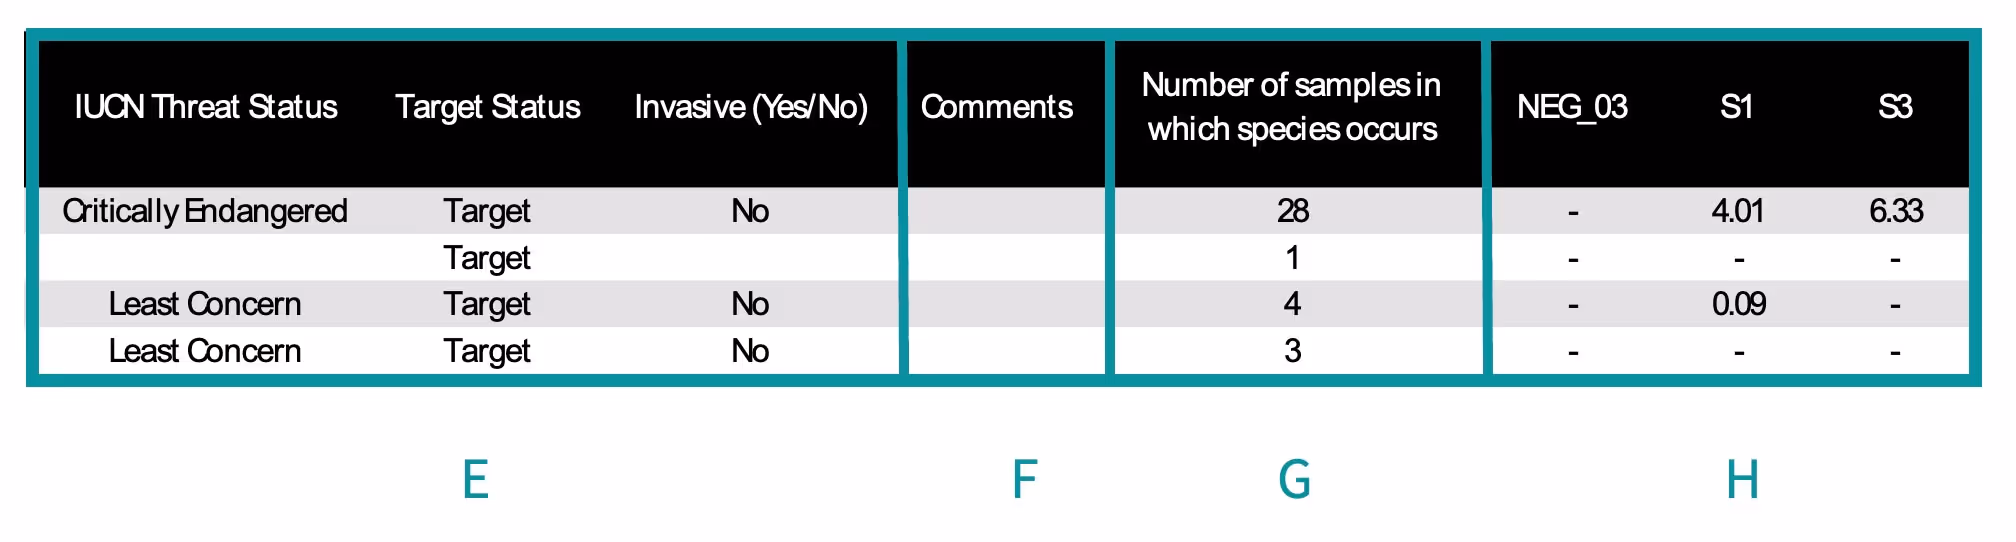
- E. Status – Information for three different categories. The first column is the species status as determined by the IUCN Threatened Species. The second column indicates if this species was within the targeted group of the test. For example, if the species was a mammal, detected by the mammal test, then it is classified as a ‘target’ (i.e., a species intended to be detected). Whereas the detection of a fish would be classified as a ‘non-target’ (i.e., it is not a mammal and was not intended to be detected by the mammal test). The third column shows Invasive Species status, as determined by GRIIS. Invasive species status is reported for species detected in marine samples, but note that results are based on invasive species presence by country and should be interpreted with caution in countries that border multiple seas or oceans. For example, the blue crab (Callinectes sapidus) is native on the Atlantic coast, but invasive on the Pacific coast of the USA and this dataset will identify this species as invasive for any detection in USA waters – even though it is native along the Atlantic coast.
- F. Comments – Provides information if something noteworthy occurred during sample processing.
- G. Number of samples in which a species occurred – Indicates the total number of samples in which the species was detected.
- H. Samples – Column headers are the name of each sample. These columns contain the percentage or number of DNA sequences for each of the species (rows) within each sample. Each sample has its own column.
Metrics by Sample Table
NatureMetrics offers numerous metrics that add complementary ecological insights to species lists and improve the ability to monitor biodiversity. The metrics measure elements of ecosystem composition and ecosystem functioning, which are key components of ecosystem integrity in monitoring and reporting frameworks. Results are reported as averages (means) among samples and groups of samples.
Metrics are most informative when compared among multiple sites each with multiple replicates and/or through time using our sampling recommendations. Therefore, two or more sites, or sampling times, are recommended to make the data as insightful as possible. If you want us to advise on exactly how many samples to take in which locations, we offer a survey design consultancy service. We do not recommend comparing metrics between projects, because they are often location dependent. For example, high species richness in one region could be considered low species richness in another region.
The specific metrics provided with data in your report will depend on the test (e.g., mammal, vertebrate, or fish) and if you paid for metrics. For each applicable metric the data are shown in this table. For metric-specific information please refer to the Metrics Charts section in this guide. The table below shows the metrics included in your report.
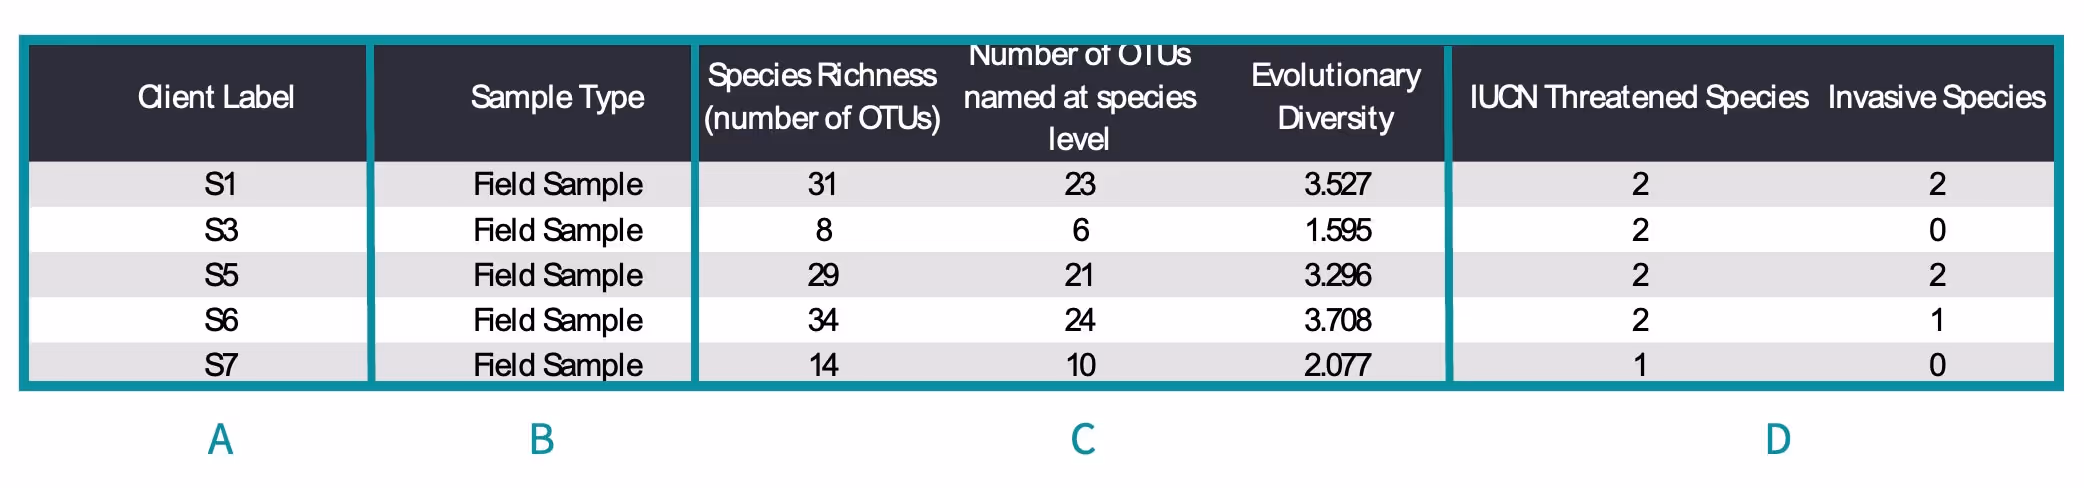
- A. Client Label – The sample name provided by you.
- B. Sample Type – Indicates if the eDNA is extracted from water or sediment (field sample) or from a control.
- C. Standard Metrics – the number of OTUs detected (Species Richness), the number of OTUs identified to species, and the Evolutionary Diversity of each sample.
- D. Species of Interest – The number of species detected in each sample that are threatened or invasive.
Quality Control Table

Quality control information for each sample.
- A. Sample Information – Information about each of your samples including the ID of the kit used to collect the sample, your sample name, sample type, volume of water filtered (if relevant), and the date the sample was received by the lab.
- B. Quality Control – These three columns detail which samples passed our quality control thresholds. The quantity of DNA amplified is measured to ensure that an adequate amount of DNA is present in the sample for High-Throughput Sequencing. A sample may contain insufficient DNA for sequencing for several reasons, such as minimal eDNA in the sample, DNA degradation or substances that inhibit amplification. The result ‘Passed Data QC: Yes’ indicates if a sequenced sample contained high quality data. Target OTUs Detected indicates if target species were detected. Our tests are targeted to detect specific groups of species but can detect species outside of the target species.
- C. Percentage Reads – The percent of DNA sequences within a sample that belong to the target species vs. non-target species according to the chosen test. For instance, the fish test can detect non-target species that are mammals, birds, and amphibians and these are included in reports as non-target species. If no target DNA was detected, then the ‘target OTUs detected’ column will read as ‘No’ for that sample. If this is the case, it may mean that target DNA was in very low quantities or not present.
- D. Result – If samples passed all Quality Control steps and contained either target or non-target species then it is classed as ‘Yes’ for reported. Outcome is a statement on whether a sample was reported, if it had target species or only non-target species, and, if applicable, whether any contamination was found in the Field blanks.
Common Queries about Results
What is an OTU?
Throughout the report you’ll see reference to ‘OTU’. This stands for Operational Taxonomic Unit. An OTU is a DNA sequence found in a sample, and, in most cases, is broadly equivalent to a species. An OTU is analogous to a species, but ‘OTU’ is used instead of ‘species’ because there are instances when eDNA results may differ from what is defined as a species. For example, an OTU can represent a few different but very similar DNA sequences because individuals within a species can have slight differences in the target DNA sequences and small changes can occur during sequencing. In these instances, these similar DNA sequences are grouped together and presented as 1 OTU to make OTU results correspondent with species. Finally, some tests may have the same OTU for more than 1 species or exact matches to a reference DNA sequence are not found for an OTU, but multiple similar reference DNA sequences are found from different species. In both these instances we cannot confidently assign a species to the OTU and the results are assigned as the lowest common taxonomic level (i.e., genus or family).
There are species in my dataset that I would not expect
DNA can enter a sample through multiple pathways. Most of the time, DNA present in a sample has been released from nearby organisms, and we assume that detection of a DNA sequence indicates presence of that species. Occasionally, DNA can enter a sample without the species of origin being nearby resulting in false positives from Contaminant DNA. Contamination is something we take very seriously in our laborotories, which are designed to minimise the risk of contamination by having physical separation of pre- and post-PCR workflows, strict unidirectional workflows, integrated UV lighting on all workstations for the routine decontamination of workspaces, and advanced air handling systems that maintain positive and negative pressure in the appropriate spaces. Our sampling kits are sterile and our aquatic eDNA filters are housed in a protective casing to further minimise contamination. However, we cannot control contamination during sampling. DNA contamination can occur via people, field equipment, vehicles, and domestic animals, and DNA can be introduced to a sample from fishing bait, or even your lunch. It is important to consider these factors when designing your sampling strategy and collecting your samples.
There are species absent from my dataset that I expected to be there
Not detecting a species does not always mean that the species was absent. Different species shed DNA at different rates; although eDNA can be detected at very low concentrations, organisms that shed large amounts of DNA are more likely to be detected than organisms that shed very small amounts of DNA. eDNA from different species also breaks down at different rates, meaning some species can be detected for longer periods than others after they were physically present. Furthermore, eDNA breakdown can be accelerated by environmental factors (e.g., temperature, pH, salinity), and eDNA can be diluted and transported in turbulent water systems or remain highly localised in still water systems. A well-designed sampling strategy can improve the chances of detecting rare species or species that are present in small numbers. It is important to follow our Sampling Guidance (general guidance for how many samples should be taken based on study area) to maximize the likelihood of species detection, which can be enhanced with more samples. You may also wish to consult our specialist team for a bespoke sampling design.
Some of my samples have delivered inconclusive results
Target DNA may be absent, and sequencing is not always successful for all samples. Samples without data that do not pass NatureMetrics quality control steps could be attributed to DNA degradation or PCR inhibition. DNA degradation is a process by which DNA is broken down and may not be detected. The use of preservatives in our kits minimizes the risk of DNA degradation, but degradation can occur in suboptimal storage conditions, such as being left in direct sunlight or at high temperatures. PCR inhibition is when compounds present in the sample (e.g., acids) interfere with DNA sequence amplification (PCR), which reduces detection. Another quality control step includes the number of DNA sequences assigned to the target group. Our tests are chosen because they are extensively validated but they can sometimes amplify species outside the intended target (e.g., our invertebrate test often detects bacteria too). Samples that have a minimal number of target taxa are not reported. To ensure you receive the most robust, reliable results, we only report results that pass our rigorous quality control steps. It is important to follow our sampling protocols and guidance to maximize the number of samples that pass our quality control steps.
Get the best results from your samples and avoid inconclusive results by following our guidance here
Not many of my OTUs have been identified to species-level
In some geographic locations, some local taxa may not be in the reference databases. This will result in a higher number of OTUs that cannot be identified to species. If you are concerned about the quality of reference databases in your sampling area, please contact us before sampling. We also have a barcoding kit for fish and amphibians so you can send us tissue samples and we can add these species to reference databases. Some groups, such as bacteria, have incomplete reference databases due to the difficulty in taxonomically describing species.
What is an ASV and how is if different from an OTU
Another term used for DNA sequences from eDNA is Amplicon Sequence Variants (ASV). These are like OTUs, which we use, but ASVs are not grouped. The OTU approach limits PCR and sequencing errors by clustering highly similar sequences. In contrast, ASVs keep each unique DNA sequence separate but attempt to fix potential PCR and sequencing errors based on error models. We report OTUs in our reports because reporting hundreds or thousands of ASVs would make it difficult for our clients to digest, and OTUs are easier to interpret because they are closely related to species. However, our taxonomic assignments are made via sequence similarity searches of the ASV sequences, and only after taxonomic assignment are the DNA sequences clustered to produce OTUs. This is more robust than the traditional approach of clustering of ASVs prior to taxonomic assignment.
In any case, all the DNA sequences are recorded and given identifiers so taxonomy can be reassigned in the future.
Methodologies
DNA Extraction
DNA from each sample is extracted using a commercial DNA extraction kit with a protocol modified to maximise DNA yields. An extraction blank is also processed alongside each batch of samples being extracted. Extracted DNA is then purified for freshwater samples to remove PCR inhibitors using a commercial purification kit.
Metabarcoding
Purified DNA extracts are amplified with PCR using primers that target a specific region of a barcode gene (i.e., test). The PCR reaction is repeated many times on each sample to maximise the detection of target species. We have run many experiments to determine the optimal number of PCR replicates for our different sample types. A PCR blank is performed along with all PCR reactions. Amplification success is determined by gel electrophoresis. PCR replicates for each sample are pooled and purified, and sequencing adapters are added that uniquely identify DNA sequences from each sample. All purified, indexed PCR products are pooled in equal concentrations into a final library. The final library is sequenced using an Illumina MiSeq.
DNA sequence data are processed using a custom bioinformatics pipeline for quality filtering, OTU clustering, and taxonomic assignment. Quality control thresholds are applied to minimize false positives. Taxonomic assignments are made for each DNA sequence by similarity matching with reference databases relevant for the gene being targeted. NatureMetrics uses NCBI nucleotide (GenBank), the Barcode of Life Database (BOLD), SILVA and the NatureMetrics Database of Life. The Global Biodiversity Information Facility (GBIF) is used to determine taxonomy for consistency between databases. Results from all searches are combined and assignments made to the lowest possible taxonomic level where there are consistent matches. Assigned taxa are checked against GBIF occurrence records for presence in the country of origin. DNA sequences are removed that are unidentified or identified as common contaminant DNA including human and livestock animals.
Note that unidentified or misidentified species can result from incomplete or incorrect reference databases, and species may be missed due to low quality DNA or the dominance of other species in the sample.
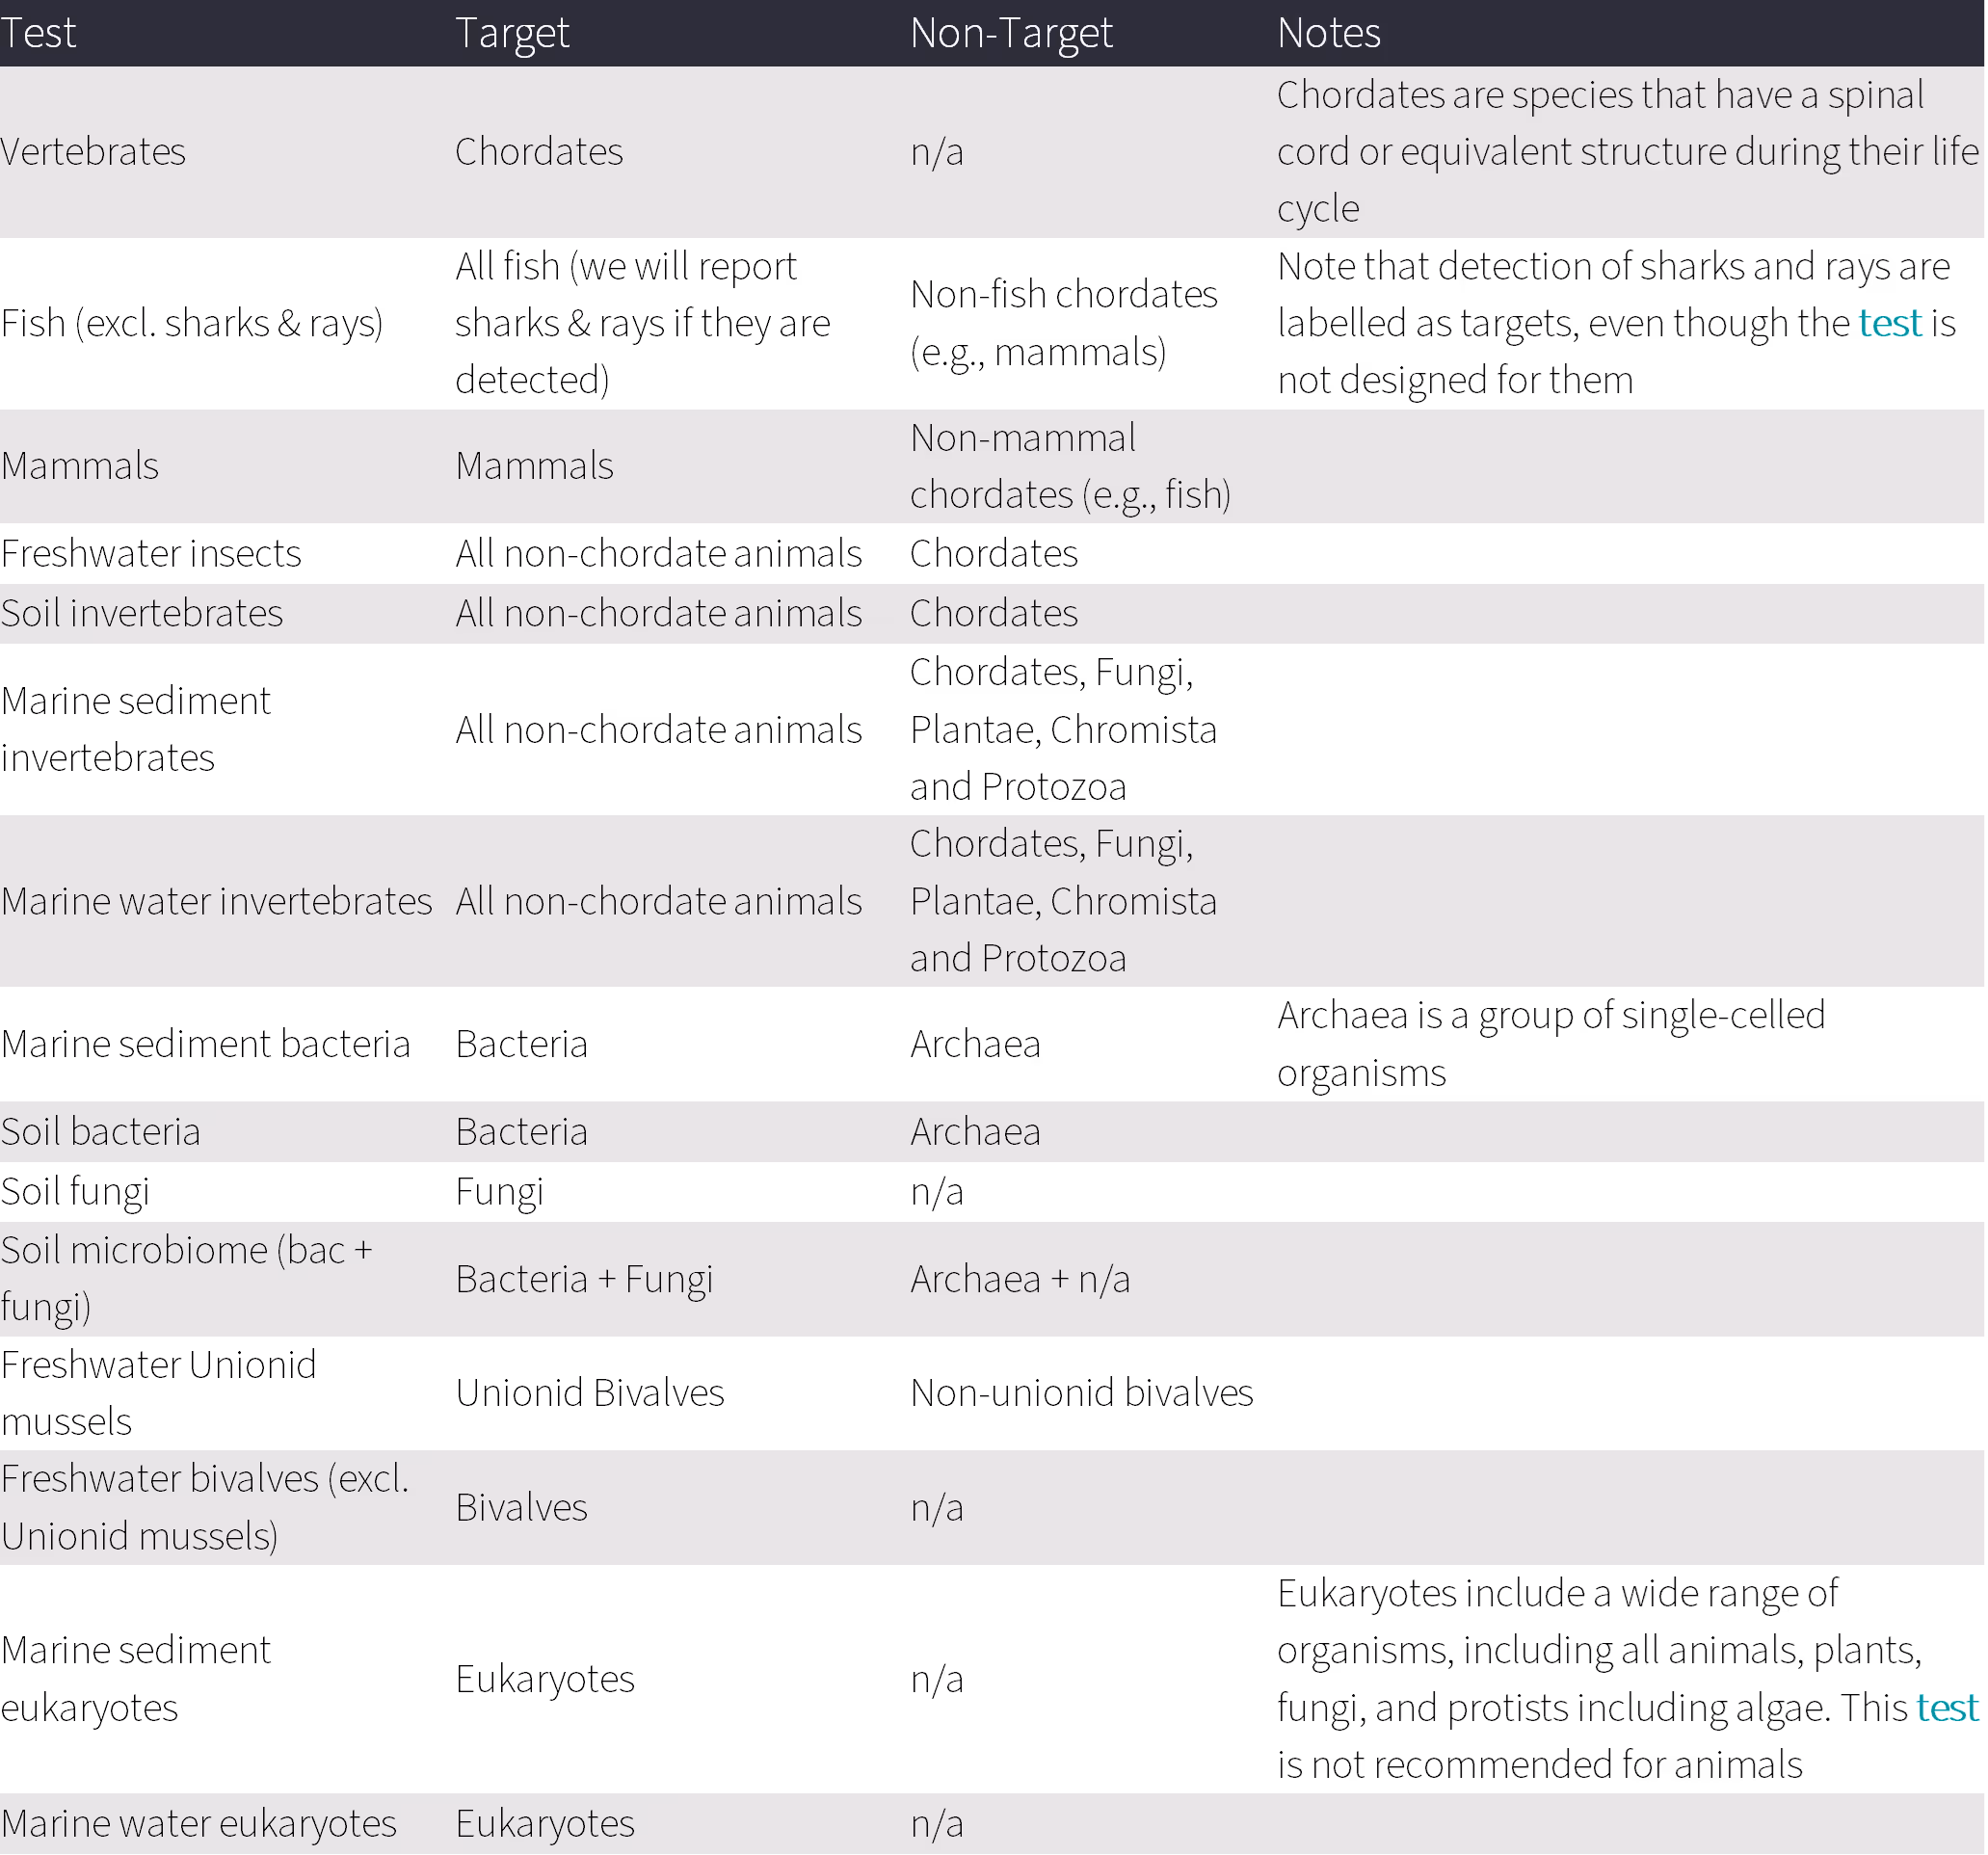
Target and Non-Target Species for each Test
Glossary
- Extinct (EX)– No individual of this species remains alive.
- Extinct in the Wild (EW)- Surviving individuals are only found in captivity
- Critically Endangered (CR) – Species faces an extremely high risk of extinction in the wild, e.g., population size estimated at fewer than 50 mature individuals.
- Endangered (EN) – Species faces a very high risk of extinction in the wild, e.g. population size estimated at fewer than 250 mature individuals.
- Vulnerable (VU) – Species faces a high risk of extinction in the wild, e.g. population size estimated at fewer than 10,000 mature individuals and declining.
- Near Threatened (NT) – Species is below the threshold for any of the threatened categories (CR, EN, VU) but is close to this threshold or is expected to pass it in the near future.
- Least Concern (LC) – Species is not currently close to qualifying for any of the other categories. This includes widespread and abundant species.
- Data Deficient (DD) – There is currently insufficient data available to make an assessment of extinction risk. This is not a threat category – when more data becomes available the species may become categorised as threatened.